Low Speed Collisions by: Trevor Newbery and Dr. Robert C McElroy
INTRODUCTION:
According to General Motors, in 1986, more than 33% of all automobile injuries occurred in low-speed collisions where the speed difference between the vehicles was less than 20 mph. It has also been estimated that more than 75% of low-speed collisions resulting in injury are rear-end collisions (see Figure 1).

Figure 1. Injuries and Low Speed Collisions.
Over the past forty years, there has been a significant amount of research into the effects of vehicle collisions and resultant occupant movement. However, the majority of this research concentrates on the effects of high collision speeds, typically 30 mph or above. Most staged collisions performed by car manufacturers, insurance institutions (Insurance Institute for Highway Safety), and the United States Government (National Highway Traffic Safety Administration) are frontal collisions at speeds of 30 to 35 mph into a rigid barrier.
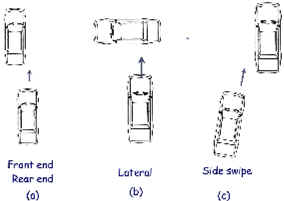
The four main types of low-speed collisions are front-end, rear-end, lateral, and side-swipe
(see Figure 2 above). Many low-speed collisions, occupants claim common "whiplash" symptoms such as pain in the neck, shoulders, arms, and low back, despite the absence of vehicle damage. Investigators are frequently asked whether the claimed injuries could have resulted from what appears to be a trivial event. To address this question, investigators must first determine the severity of the collision and then compare that value to human injury tolerance levels.
IMPACT SEVERITY:
Before looking at the ways to determine the severity of a low-speed impact, it is first important to understand the difference between high-speed and low-speed impacts. When two vehicles collide at a high speed, they essentially act like two balls of clay. They deform on impact and remain deformed with little or no crush energy being released after impact. There is little or no "bounce" or elastic behavior during the impact. The engineering term for this "bounce" or elastic behavior is restitution. In high-speed collisions, the restitution approaches a minimum value of zero and, therefore, when reconstructing high speed collisions, restitution is usually ignored.
When two vehicles collide at a very low speed, they act more like two tennis balls. A large percentage of the deformation of the vehicles is elastic in nature and is released after impact. Only a small percentage remains as permanent crush damage. In low-speed collisions, the restitution approaches a maximum value of one (see Figure 3). Therefore, when reconstructing low-speed collisions, the effects of restitution cannot be ignored.
Figure 3. Restitution and Speed Difference.
The severity of a collision is quantified by the acceleration (or deceleration) experienced by a vehicle during impact. Acceleration is speed change divided by time. If collision duration is assumed essentially constant, then velocity change can be used to quantify collision severity. This is a valid assumption for most collisions where the time duration is approximately 1/10th of a second. However, in collisions such as under-ride impacts, the time duration is much greater, and great care must be used if speed change is chosen to quantify collision severity.
In general terms, the severity of an impact is related to vehicle damage. A vehicle that has sustained several inches of rear-end crush has experienced a more severe impact than the same vehicle that has less or even no permanent rear-end damage. However, there are significant differences between the relative strengths of different surfaces of the same car, and between the same surfaces of different cars. For example, the rear ends of two different cars will not be equally strong, so that two different cars with similar damage may not have experienced the same impact severity.
Where there is bumper engagement with no damage in a rear or front impact, it is often possible to determine impact severity from an inspection of the vehicle bumpers. In many cases, the amount of compression of bumper isolators can be correlated to the vehicle’s _V (velocity change) in a minor front or rear impact. In non-isolator equipped cars, which are increasingly more common, the task of determining severity is more difficult. For many passenger cars in North America, there is often little or no damage after a minor impact. Some Asian cars in particular have quite robust foam-core bumpers that are more damage resistant. (See Table 1 below)
|
Manufacturer |
Models |
| Acura | Integra, Legend, NSX, Vigor |
| Geo | Metro, Sprint, (99 and later) Prizm |
| Honda | Accord, Civic, Prelude |
| Hyundai | Elantra, Excel, Stellar |
| Infiniti | G2O, Q45 |
| Lexus | FS230, ES300,LS400, SC300, SC400 |
| Mazda | MX-6, 323, 626, 929 |
| Nissan | Axyess, Maxima, Micra, NX, Pulsar (87 & later), Sentra, (87 & later) 200SX, 300ZX |
| Subaru | Loyale, Justy, Legacy, SVX |
| Suzuki | Swift |
| Toyota | Camry, Cleica, Corolla, Cressida, MR2, Supra, Tercel |
Table 1. Vehicles equipped with foam core bumpers.
In lateral and side swipe impacts, the damage is more noticeable, since the body panels, which are much weaker than bumpers, are involved. Body panel dents and horizontal scuffs and creases are easily produced with very minor impacts.
Currently in the United States, a federal safety standard requires that automobile bumpers keep damage away from car bodies in 2½ mph front- and rear-into-flat-barrier impacts. Damage is allowed to the bumper itself. These requirements are much weaker than the stronger 5 mph no-damage bumper rule that was in effect during the 1980 to 1982 model years. Neither strong nor weak bumper requirements have ever applied to trucks or vans.
Low speed crash tests indicate that many bumpers are built to exceed the standard and in some cases are undamaged at speeds well in excess of those set out in the standards.
Damage sustained by vehicles during impacts varies greatly among models and manufacturers. Certain vehicles show no evidence that an impact occurred, even after impacts with severities as high as 10 mph delta V while others have incurred structural damage during very low severity impacts. These differences in vehicle behavior help explain instances where one vehicle will show large amounts of deformation while the other vehicle will appear undamaged.
Often, investigators will underestimate the impact severity because no damage was observed during the vehicle examinations. Similarly, overestimates have also been made when the vehicles show obvious damage. Closer investigation into vehicles’ properties will provide insight into relationships between vehicle damage and the corresponding impact severity.
Table 2 summarizes the results from staged collisions carried out by MacInnis Engineering. From the table, it can be seen that the type of vehicle engagement during collision and type of impact both need to be considered when determining collision severity.
|
Impact Type |
Damage |
Probable Maximum Severity (mph-V) |
| Rear | Bumper engaged, no cosmetic, structural or other damage | 10 |
| Bumper not engaged, none or very minor trunk or tail light damage | 5 | |
| Front | bumper engaged, no cosmetic, structural or other damage; no air bag deployment | 10 |
| minor damage to grille, headlights, bumper, no air-bag deployment | 13 | |
| Lateral | very minor body panel damage, no wheels or tires hit | 5
|
Table 2. Damage and Probable Maximum Severity.
HUMAN INJURY TOLERANCE LEVELS
When trying to understand the motion of an occupant subjected to a low speed front- or rear-end collision it is useful to visualize the occupant as a simple head-on-a-stick. Figure 5 illustrates this model applied to a rear-end collision.

Figure 5. Occupant Head-on-a-Stick Model.
Whenever a vehicle is rear-ended, everything moves forward. This includes the vehicle, the seat, the occupant’s torso and the occupant’s head. However, there is differential motion. The car and seat move fastest, the torso initially moves more slowly, and the head moves slowest of all. Consequently, the occupant suffers the sensation of "sinking back" into the seat, while their head suffers a rearward rotation (this is the origin of the so-called "whiplash" mechanism). As the torso sinks back into the seat (but actually moving forward), the seat compresses like a spring. Ultimately, this compression stops and the torso reaches the same speed as the car. Thereafter, the seat "unloads" and acts as a damped spring, resulting in the torso moving forward faster than the car. As a result of this "seat bounce," the torso can move forward up to about 1.3 times the speed change that the car experiences due to impact. Thus, if the car experiences a velocity change of 5 mph due to a rear impact, the torso can end up moving at up to 6.5 mph. Whether the occupant actually experiences this increase in speed depends on the lockup behavior of the seat belt, especially the shoulder belt.
|
Impact Type |
Damage |
Probable Maximum Severity (mph-V) |
Range of Symptoms |
| Rear | Bumper engaged, no cosmetic, structural or other damage | 10 | symptoms start at 4-5 mph Insufficient data above 5.5 mph -V |
| Bumper not engaged, none or very minor trunk or tail light damage | 5 | none to neck/head/back ache /stiffness/discomfort lasting 24hr. | |
| Front | bumper engaged, no cosmetic, structural or other damage; no air bag deployment | 10 | none, to minor ; ouch level |
| minor damage to grille, headlights, bumper, no air-bag deployment | 13 | none to neck pain, chest pain, back pain or headache | |
| Lateral | very minor body panel damage, no wheels or tires hit | 5
|
none |
Figure 6. Occupant Motion During Rear-End Impact.
Figure 6 illustrates the motion of an occupant during a rear-end impact. A potential for injury occurs when the head is fully rotated backwards [no.6], known as hyperextension, or fully rotated forward [no.8], known as hyper flexion. A properly positioned head rest can reduce the amount of backward head rotation and hence reduce the potential for head injury.
Once the severity of the collision has been determined, then this value can be taken and compared to human injury tolerance levels. Results from daily activities or volunteer exposure to staged low-speed collisions can be used.
1. Daily Activities: The loads that an occupant was subjected to during a collision can only be compared to daily activities if the direction, duration, and magnitude of the loads are the same. For short time durations, less than a second, human injury tolerance is sensitive to the time duration that the load is applied. A higher load can be applied without injury if the time duration is shortened.
If an individual jumps off of a table on to a solid floor, then he or she will be subjected to a fairly high deceleration on impact. But injuries typically do not occur because time duration of the impact is of the order of a 1000th of a second.
Tests carried out with amusement park bumper cars reveal that, during collisions, vehicle velocity changes as high as 5 m.p.h. can occur. The time interval of these impacts is comparable to the typical duration of a low speed automobile impacts.
2. Volunteer Exposure: MacInnis Engineering has performed many staged low-speed collisions with human volunteers (see Figure 7).
|
Impact Type |
Damage |
Probable Maximum Severity (mph-V) |
Range of Symptoms |
| Rear | Bumper engaged, no cosmetic, structural or other damage | 10 | symptoms start at 4-5 mph Insufficient data above 5.5 mph -V |
| Bumper not engaged, none or very minor trunk or tail light damage | 5 | none to neck/head/back ache /stiffness/discomfort lasting 24hr. | |
| Front | bumper engaged, no cosmetic, structural or other damage; no air bag deployment | 10 | none, to minor ; ouch level |
| minor damage to grille, headlights, bumper, no air-bag deployment | 13 | none to neck pain, chest pain, back pain or headache | |
| Lateral | very minor body panel damage, no wheels or tires hit | 5 | none |
It should be noted that in the staged rear-end and lateral collisions, none of the reported symptoms lasted longer than three days. Several interesting trends can be observed from their results. In the staged rear end collisions, symptoms started to be reported at collision severities in the 4 to 5 mph range. In the frontal and lateral staged collisions, symptoms started to be reported at about 10 mph. The results indicate that the injury threshold level for a frontal collision is greater than for a rear end collision. This is consistent with typical real life low speed rear-end collisions where occupants of the struck vehicle report injuries, but the occupants of the striking vehicle do not.
When using results from volunteer exposure tests, an investigator should be aware of the following limitations:
1. Most of the staged collisions are bumper to bumper impact and not override/ under-ride impacts.
2. Most of the volunteers have been male.
3. Most of the volunteers face forward at the time of impact.
4. Most of the volunteers are under 50 years of age.
5. Most of the volunteers are seat belted.
6. Most of the volunteers do not have pre-existing conditions.
7. Most of the volunteers are mentally prepared for the impact.
8. It is difficult but not impossible to insure that a volunteer is subjected to an unexpected impact.
Table 3 combines MacInnis Engineering's vehicle damage threshold and volunteer exposure results. From the table it can be seen that in a rear-end impact it is possible for occupants to sustain symptoms when the vehicle has no visible damage.
|
Impact Type |
Damage |
Probable Maximum Severity (mph-V) |
Range of Symptoms |
| Rear | Bumper engaged, no cosmetic, structural or other damage | 10 | symptoms start at 4-5 mph Insufficient data above 5.5 mph -V |
| Bumper not engaged, none or very minor trunk or tail light damage | 5 | none to neck/head/back ache /stiffness/discomfort lasting 24hr. | |
| Front | bumper engaged, no cosmetic, structural or other damage; no air bag deployment | 10 | none, to minor ; ouch level |
| minor damage to grille, headlights, bumper, no air-bag deployment | 13 | none to neck pain, chest pain, back pain or headache | |
| Lateral | very minor body panel damage, no wheels or tires hit | 5 | none |
Table 3. Damage Threshold and Volunteer Exposure Results
CONCLUSION
Using the results from staged low speed collisions, conducted at known speeds, it is possible to determine the collision severity of a real life low speed collision. The determined impact severity can then be compared to results from staged low speed collisions to determine if injury threshold has been reached.
Volunteer exposure tests give a good indication of the collision severity at which symptoms, typically lasting less than 2 to 3 days, start to appear (i.e. the injury threshold). Because human volunteers are used, the severity of the staged collisions is typically not increased beyond the injury threshold severity. Therefore, there is currently little or no data to indicate the relationship between injury severity and collision severity above the injury threshold.